

Julie Ainsworth, Coordinator Dairy Production Analysis PAS, NorthStar Cooperative
Forgotten Cows
You know you have them, you just don’t always know who they are. Cows that never get sick, produce well and breed right back. They may not set the world on fire in any one particular area, but overall profitable cows. In contrast are the cows we really remember . . . high producers, chronically high SCC, routine mastitis, sore feet, trouble calving, and oh yea let’s not forget the kids show animal or pet.
As herd size grows and labor is increasingly harder to find, it’s critical that we identify who our “forgotten cows” are and devise a plan to make more of them. So the question is, can we breed for those types of cows, and can we quantify it. The answer to both is YES!
There are many different ways we can now measure genetic impact for health, production and fertility by combining your dairy herd management data (PC DART, Dairy Comp) or genomic test results with a program developed by Select Sires. This will be the first in a series of articles you will see here in The POINT regarding measuring genetic merit.
We will start with taking a look at a sampling of the ways genetics impacts your herd’s health and your bottom line.
Bottom Line
An investment in better genetics can create more “forgotten cows” — cows that are pregnant, healthier, live longer and add dollars to your bottom line. Your NorthStar team can show you how genetics are working in your herd, and can help design a plan to create trouble free, profitable cows for the future.
If you have questions or would like to see this information for your herd please ask. Remember it’s important not to skimp on genetics. Invest in the best you can, your herd’s future depends on it.
Productive Life (PL)
Productive Life (PL) is the measurement of the number of months a cow is expected to stay in the milking herd. The higher the number the better. Using Dairy Comp 305 data and sire pedigree, this example shows a lot of differences in the life of the animal in the herd, as well as health events, so let’s break it down.
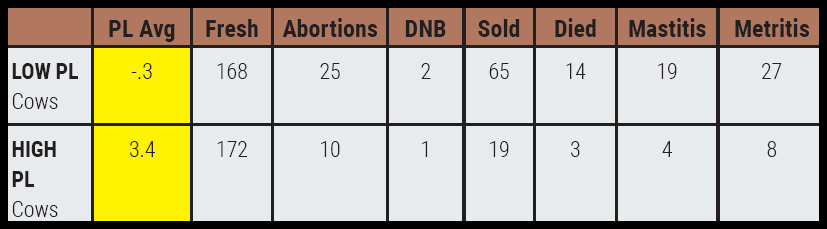
The High PL cows stay ¡n the herd on average 3.7 more months than the Low PL group. That means more milk produced and shipped. But take a look at the difference in health events by group and consider the costs.
There are significantly more instances of Mastitis, Metrities and Abortions in the Low PL group.
Considering the average costs of these incidences per lactation: Mastitis/$75 and Metritis/$125; as well as other health incidences DA/$178; Ketosis/$28 and Retained Placenta/$68, the opportunity to select genetics that minimize these costs can definitely impact the bottom line.
Somatic Cell Score (SCS)
In an extremely well-run dairy where somatic cell is not an issue, would SCS make a difference? Remember SCS is an indicator of mastitis in a bull’s daughters based on the direct measure of somatic cells in milk samples. The lower the number the better.
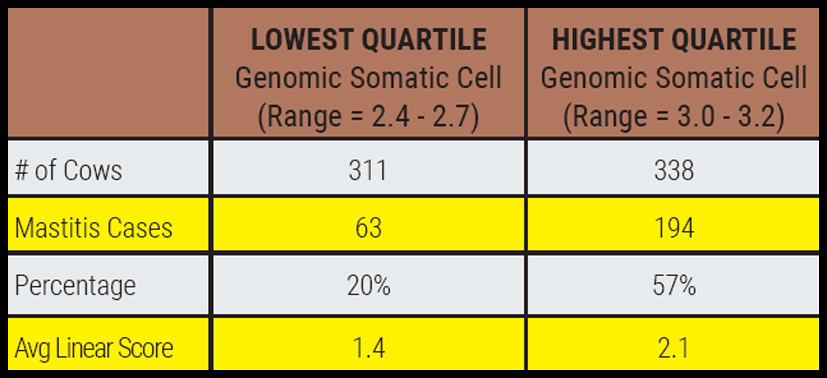
This example uses genomic data. With nearly a similar number of cows in each group, it’s easy to see that the lowest quartile for SCS has significantly fewer cases of mastitis and a much lower average linear score. Considering that one case of mastitis costs on average $75/lactation, paying attention to SCS can make a difference to your dairy.
Livability (LIV)
Livability is a fairly new measurement and is best defined as an evaluation of the percent of a bull’s daughters that remain alive in the milking herd until they are culled. Higher values are better.
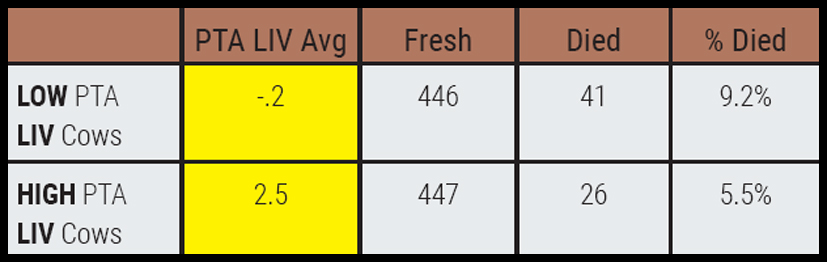
Using farm data we can see genetic influence at work. There is a difference of 2.7 months between the Low and High LIV groups. Comparing similar group sizes (Fresh column), you can also see that 15 more animals died in the Low LIV group compared to the High LIV group. Longer lasting cows = more milk to ship = improved bottom line.
Daughter Still Birth (DSB)
Are you having any issues with calves being born alive, especially in first lactation heifers? DSB measures the ability of a bull’s daughter to deliver a live calf. Expressed as a percent of still born calves, the lower the value the better.
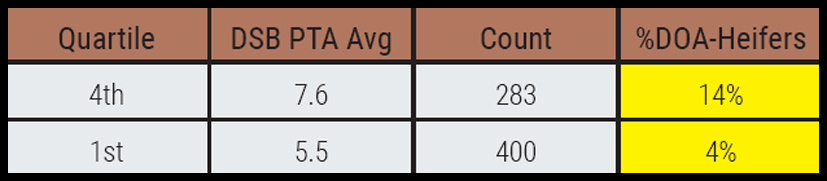
Using sire pedigree index and first lactation data only, this example shows a 10 percent improvement in live calves from the cows in the first quartile. Even at a low estimated value of $150-$200 for a live calf, the difference to the bottom line adds up, as does keeping the pipeline full of replacements for the future.
Proof that Genetics are Worth the Investment Part 2
Julie Ainsworth, Coordinator Dairy Production Analysis PAS, NorthStar Cooperative
In the last issue we explored how Productive Life (PL), Somatic Cell Score (SCS), Livability (LIV) and Daughter Still Birth (DSB) impact your herd’s bottom line. In this issue we will again combine dairy management data(PCDÀRT, DairyComp) or genomic test results with a program developed by Select Sires to take a closer look at production and health traits, and how to measure their impact in your herd.
Pedigree Index Milk Production
Although herds can almost always measure milk production on individual cows it breaks cows into four quartiles based on different sire PTA Milk (PTAM) levels. The bottom quartile represents cows sired by bulls that were less than 120.25 PTAM, while the top quartile represents cows sired by bulls that were greater than 760.75 PTAM. The bars show actual production for cows in that quartile.
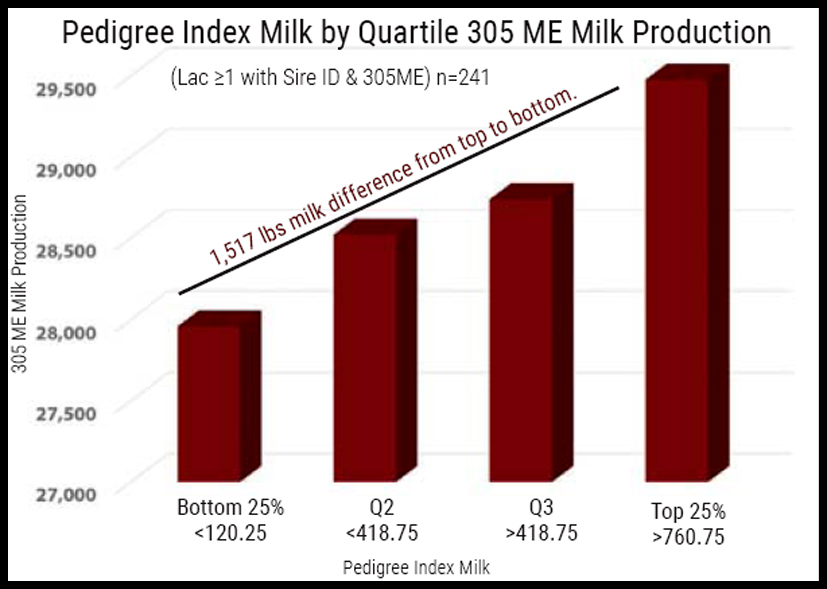
The graph clearly shows the difference in production when PTAM is considered. In this example the difference between the top and bottom quartiles represents 1,500+ more pounds of milk per cow on a mature equivalent basis. Milk production is an important selection tool, so even when selecting “clean-up sires” don’t overlook the importance of PTAM and how it contributes to your bottom line.
Daughter Pregnancy Rate (DPR)
Can you breed for fertility? Even though it is generally considered a lowly heritable trait I have seen it make a difference many times in pregnancy rate. DPR indicates the pregnancy rate difference expected in lactating daughters of a bull, and a higher value is better. By using data from DairyComp (also available in PCDART), let’s take a look at the difference in Pregnancy Rate and Average Days Open when a herd is segmented into quartiles for DPR.
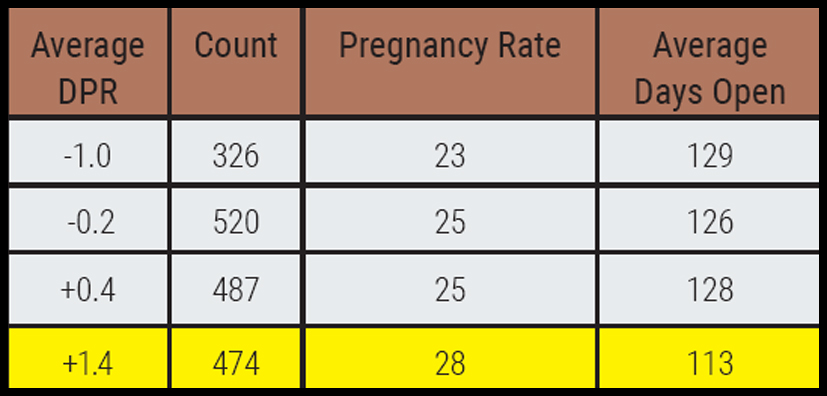
As you can see the more positive the DPR Average of the group, the higher the Pregnancy Rate and the lower Days Open. There is a difference of 16 Days Open between the low DPR group and the high group. Applying information from research done by Victor Cabrera the economic difference between the top and bottom pregnancy rates in this example would be $63 per cow per year.
Cow Conception Rate (CCR)
Cow Conception Rate evaluates a lactating daughter’s ability to conceive when bred. Expressed in conception rate percentage fertility on farms. The following chart uses sire pedigree information that can be obtained from DairyComp and shows the differences in Conception Rate, Services per Conception and Average Days Open for the groups defined.
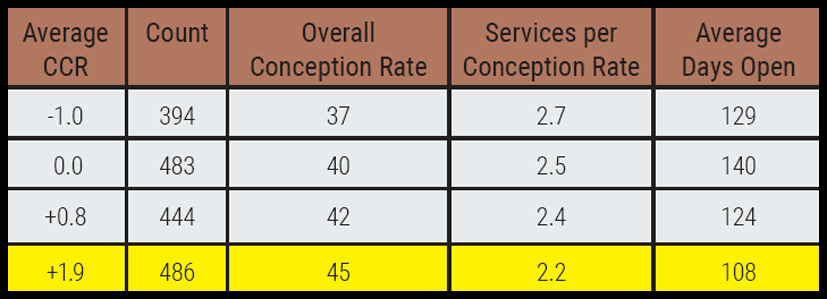
Like DPR, this example shows that the group with the lowest CCR has the least desirable performance. The highest CCR quartile has the lowest services per conception and fewer days open. Not only is the cost of extra Days Open a consideration, but consider the need for additional semen and synchronization therapy with a lower conception rate.
In this herd the 394 cows with 2.7 services per conception will require 197 more units of semen to get pregnant than if they were in the top quartile at 2.2 services per conception. When you use $20/unit semen, it adds up quickly, but the cost is even greater when factoring in labor and extra days open.
Bottom Line
NorthStar has the ability to provide insights on how genetics are working in your herd, and we’re able to quantify their impact. While reducing your semen budget may seem like a good way to save a few dollars today, in the end you can see how it will cost you.
 .
. .
. .
. .
. .
. .
.