Bill VandeGraaf, SRS Specialist
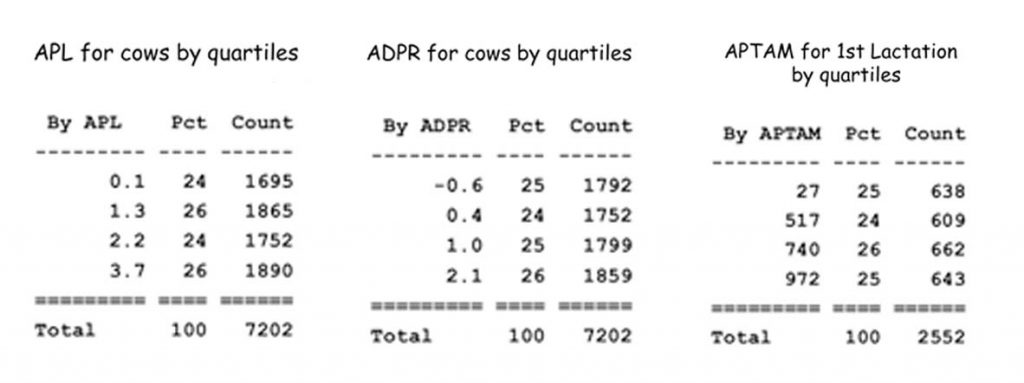
The true value of genetics has never been easy to quantify. Historically, value was not only based on genetics, but also management, personal breeding preference, and even emotion. We knew the times when a “family favorite” was just as valuable as the cow that never got sick, the 4-H project, the high-milking cow, and the one that was first in the barn every milking. It’s a different game today, and your All West team has been hard at work to quantify value in measurable traits. Why is that important? Simply put, the more you can measure, the better you can manage your herd based on any number of indexes, as well as the most important one…dollars and cents! To illustrate this, we have been working with DairyComp 305 and a new file developed by King Smith for Select Sires SRS Specialists. With this program, we can break down the herd in four equal groups, ranked by TPI, Productive Life….in fact nearly any trait you’d like to analyze. I worked with one particular herd and found some pretty interesting correlations, proving that investing in good genetics pays off in more ways than one! Look at the graphs of Dairy X:
For Productive Life – the bottom quartile averaged 0.1PL; the top quartile averaged 3.7PL. Even in traits that are not “highly heritable” there is a marked difference in the quartiles!

For “herd events” – the bottom quartile had 434 cows sold and 73 died; the top quartile had 149 sold and 18 died.
For lameness & mastitis – the bottom quartile had 463 lame events and 266 mastitis events; the top quartile had 83 lame events and 102 mastitis events
For DPR – the bottom quartile averaged –0.6DPR; the top quartile averaged +2.1DPR. Taking this a step further, we looked at the 21-day preg rate for the bottom quartile. For a 12-month period, the bottom group had a preg rate average of 23, while the top group had a 32 preg rate…a 9% difference. That’s huge when calculating cows that are eligible to become pregnant and cows that actually DO become pregnant.
Even when looking strictly at milk production, in this herd, the bottom quartile had a 28,594ME while the top quartile had a 30,338ME. The chart at left illustrates that in first lactation females, the bottom quartile was just a +27 for PTAM, while the top was +972 PTAM. What does this all mean? Investing in good genetics pays off in a number of ways, including the ones I talked about here. Yes there’s more money to be made when your cows last more lactations (PL) and are culled by you and not by lameness or mastitis. And yes, there’s absolutely more money to be made if your fertility is higher. In fact, research estimates that a 1% increase in a trait like SCR equates to a value of $6.50 when sires are used on cows. (see “How much can we pay for high-end bulls?” in Hoard’s Dairyman 2/25/16)
Bottom line – you CAN measure the value of genetics, and your All West SRS specialist has all the tools you need to chart your herd progress and make management decisions based on quartile analysis. Our SRS team gets pretty excited about “solving pieces of the herd management puzzle” anyway, but these files are an incredibly easy way to sort through herd data and performance. And there’s nothing that makes me happier than to have a customer see the analytics and say “Oh wow, that’s cool!” These types of herd analytics are available for you as well! Give us a call and we can sit down together to talk about ways to measure value in your own herd. We’re ready to help you with an industry-leading lineup of bulls, a highly skilled team of certified A.I. technicians, and an enthusiastic group of reproductive analysis folks. That’s the VALUE of ONE All West!

 .
. .
. .
. .
. .
. .
.